
Times table chart 1–12
Find the row and the column, and read the answer where they meet: 7 × 8 is in row 7, column 8. To print it, use your browser's print command (Ctrl+P or Cmd+P). The buttons and menus will not print. To check which facts your child already knows, take our free times tables test.
Published: 30 September 2026
Free printable pack
Three print-ready sheets with our dino as host: a poster, a black-and-white version to colour in, and a sticker chart with a Champion certificate.
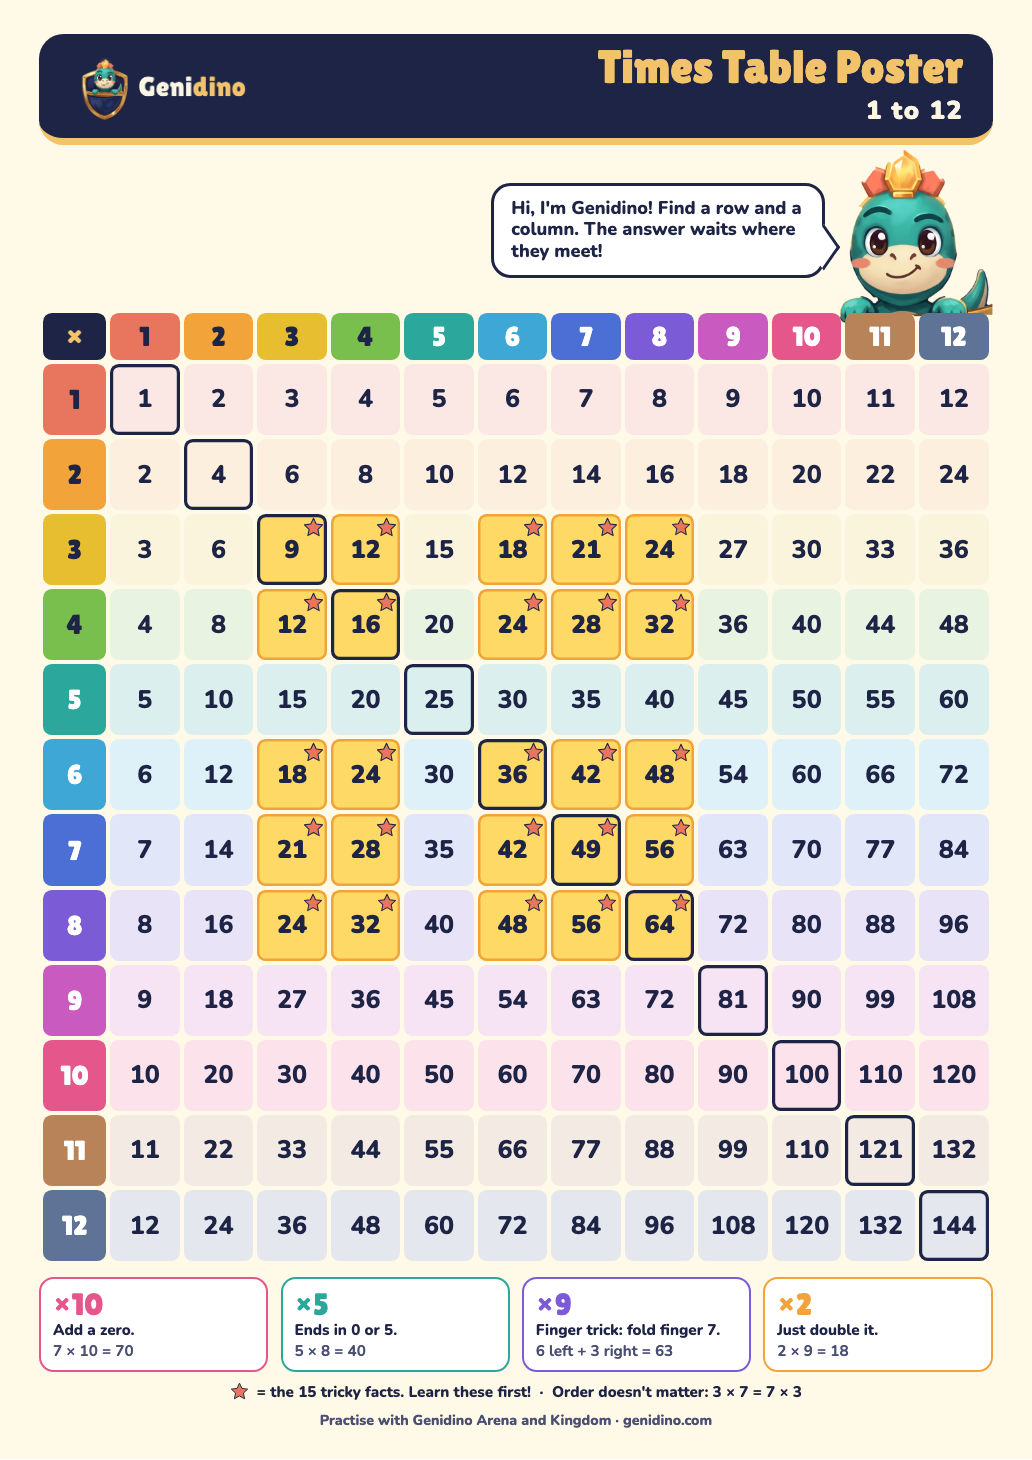
The poster
Colourful chart up to 12 × 12 with Genidino as your host. The 15 tricky facts have a star.
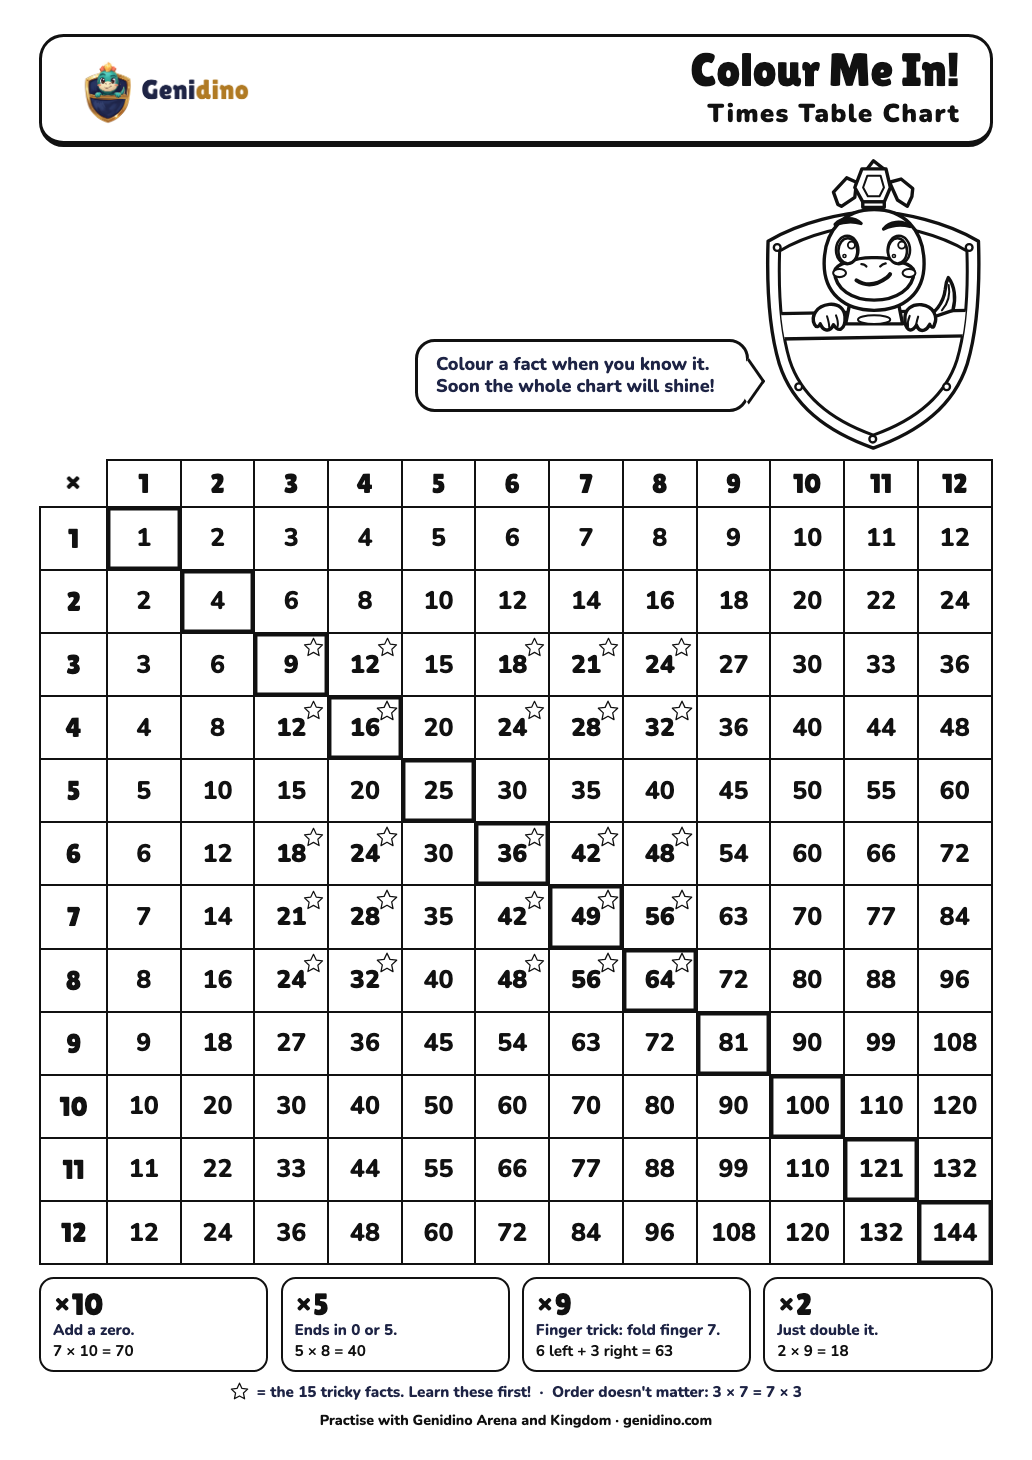
Colour-in chart
Black and white and kind to your ink. Kids colour a fact when they know it.
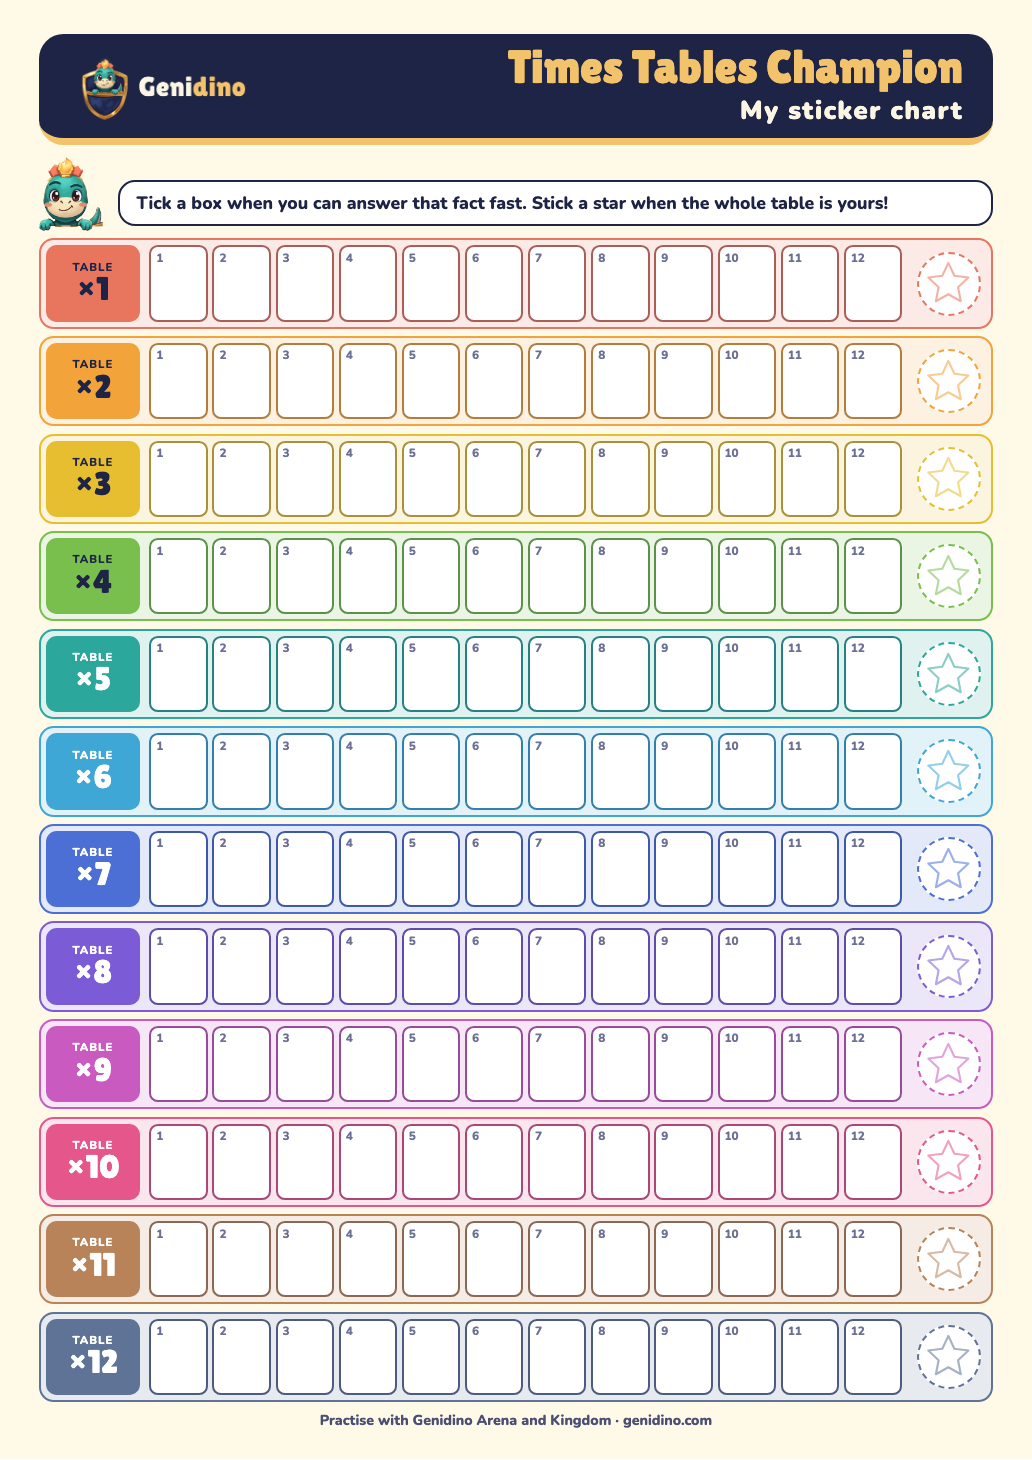
Champion sticker chart
Tick the boxes, stick a star on every finished table, then hand over the Champion certificate.
Free to print at home. Nothing to sign up for, nothing is collected.
The chart
| 1 | 2 | 3 | 4 | 5 | 6 | 7 | 8 | 9 | 10 | 11 | 12 | |
|---|---|---|---|---|---|---|---|---|---|---|---|---|
| 1 | 1 | 2 | 3 | 4 | 5 | 6 | 7 | 8 | 9 | 10 | 11 | 12 |
| 2 | 2 | 4 | 6 | 8 | 10 | 12 | 14 | 16 | 18 | 20 | 22 | 24 |
| 3 | 3 | 6 | 9 | 12 | 15 | 18 | 21 | 24 | 27 | 30 | 33 | 36 |
| 4 | 4 | 8 | 12 | 16 | 20 | 24 | 28 | 32 | 36 | 40 | 44 | 48 |
| 5 | 5 | 10 | 15 | 20 | 25 | 30 | 35 | 40 | 45 | 50 | 55 | 60 |
| 6 | 6 | 12 | 18 | 24 | 30 | 36 | 42 | 48 | 54 | 60 | 66 | 72 |
| 7 | 7 | 14 | 21 | 28 | 35 | 42 | 49 | 56 | 63 | 70 | 77 | 84 |
| 8 | 8 | 16 | 24 | 32 | 40 | 48 | 56 | 64 | 72 | 80 | 88 | 96 |
| 9 | 9 | 18 | 27 | 36 | 45 | 54 | 63 | 72 | 81 | 90 | 99 | 108 |
| 10 | 10 | 20 | 30 | 40 | 50 | 60 | 70 | 80 | 90 | 100 | 110 | 120 |
| 11 | 11 | 22 | 33 | 44 | 55 | 66 | 77 | 88 | 99 | 110 | 121 | 132 |
| 12 | 12 | 24 | 36 | 48 | 60 | 72 | 84 | 96 | 108 | 120 | 132 | 144 |
The tinted cells are the 15 facts that most children need to practise on purpose: every pair of 3, 4, 6, 7 and 8. The other facts come from patterns that are easy to learn (see below).
Each times table on its own page
One page for each times table, with the division facts and a trick for learning it: 2×, 3×, 4×, 5×, 6×, 7×, 8×, 9×, 10×, 11×, 12×.
How to use the chart with your child
- Colour in what they know. Print it and let your child colour the facts they can answer without thinking. Keep it on the wall and add more each week.
- Look for patterns. Every answer in the ×5 row ends in 0 or 5. The ×10 row is the ×1 row with a zero added. The ×9 answers have digits that add up to 9. The chart is a mirror image across the diagonal, so each fact appears twice.
- Cover and check. Cover a row with a sheet of paper, ask the facts in a random order and lift the paper to check.
- Turn it around. The chart also shows division. To find 56 ÷ 7, look for 56 in row 7: it is in column 8.
The square numbers
The diagonal from the top left to the bottom right holds the square numbers: 1, 4, 9, 16, 25, 36, 49, 64, 81, 100, 121 and 144. A child who knows these has a base for the facts next to them: 7 × 8 is 7 × 7 (49) plus one more 7, which is 56.
From the chart to real recall
A chart is a reference, not practice. To turn it into knowledge, a child needs short, regular practice with mixed questions. Read how to learn times tables for a plan, and times table tricks for the hard ones.
Turn the chart into practice
Both games are free to try, with no ads and no data collected.

Genidino Arena
Times tables battle game
Every fact from the chart, asked in a battle. The ones your child misses come back until they stick.



Genidino Kingdom
Math adventure: build a village, beat bosses
Sums that build a village, including multiplication and division in the range you choose.